Data Driven Technical Analyst Course — Read the Charts Like a Professional
Learn to identify price patterns, market trends, and key indicators through structured, data-first technical analysis — in just 4 weeks.
Duration: 4 Weeks
Mode: Offline, Jaipur
Format: Fast-Track
Certification: Included on completion
Taught by a founder with 9+ years of live trading and marketresearch experience
Interested in Proprietary Trading?
Who It's For
Is This Course Right for You?
Four starting points — this course is built to take any of them further.
Beginner
Beginners who want a focused introduction to technical/chart-based analysis without a long commitment
Professional
Investors who currently rely on tips or news and want to read charts independently
Existing Trader
Working professionals looking for a quick, practical skill upgrade
Aspiring Prop Trader
Anyone considering a longer SRA program (Proprietary Trading, Diploma) who wants to try a shorter course first
By the End
What You'll Be Able to Do
Skills you'll walk away with — tested against real data, not theory alone.
Apply core research techniques to analyze any financial market
Organize and interpret historical price data using Excel-based data modeling
Read directional data trends across monthly and weekly timeframes
Analyze sector-wise market data month by month
Identify all major reversal chart patterns
Draw and interpret trendlines and breakout patterns
Apply key indicators — RSI, Supertrend, and Moving Average — in real trade decisions

The Path
Curriculum Breakdown
Three modules, then a 3-month live internship. Tap a module to see what's inside.
Course Modules
Financial Market Research & Technical Analysis
Design Notes
Suggested Week Mapping

Module 2
Derivatives, Options & Quant Strategy
Futures & options fundamentals, Greeks, backtesting, spread strategies
- Futures & options market fundamentals, Excel data modeling
- Directional quants (month / week / day-wise)
- Covered call & protective put strategy, backtesting via simulator
- Option Greeks, straddle & strangle strategy, debit/credit spreads
- Non-directional quant strategies, combined straddle/strangle chart analysis
Why Learn This at SRA
Taught by Someone Who Trades This Way, Not Just Teaches It
- Founder Aman Thuniya: 9+ years trading experience, process-driven approach to market research and analysis
- Every technique taught is grounded in real historical data, not opinion or prediction
- Practical, hands-on teaching style — analysis is applied to real charts and indices, not just theory
- A fast, focused way to build a genuine technical analysis skillset in one month
“Consistency in trading comes from systems, not emotions.”
— Aman Thuniya, Founder, SRA
Validate Your Skills
A Certificate That Holds Weight
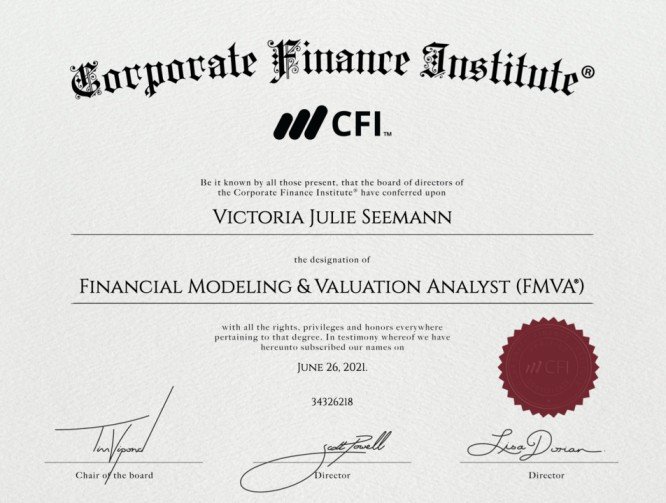
- On completion, receive an SRA certificate of completion in technical/data-driven analysis
- Recognized credential to add to your resume & LinkedIn
Enroll
Fee & Batch Details
Duration
4 Weeks
Mode
Offline, Jaipur
Fee
On Request
Next Batch
Next batch starts soon
Fee shared on request — get exact figures and current batch dates.
Our Learners
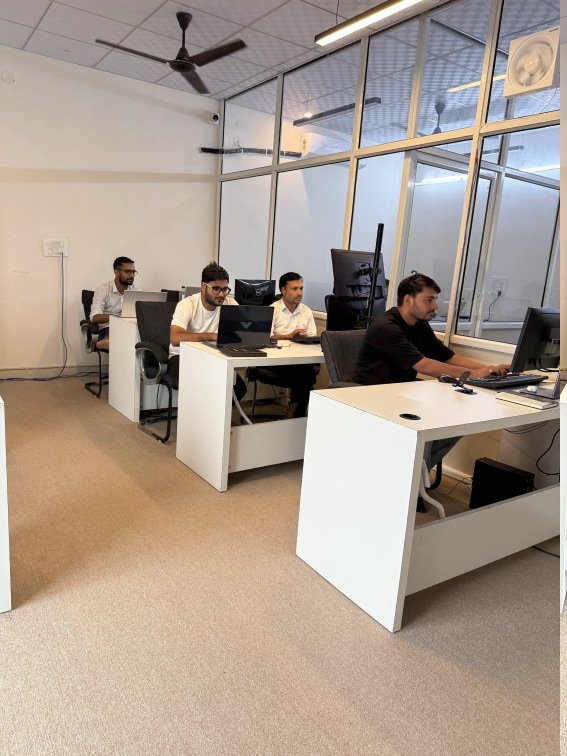
Trained on campus, in Jaipur.
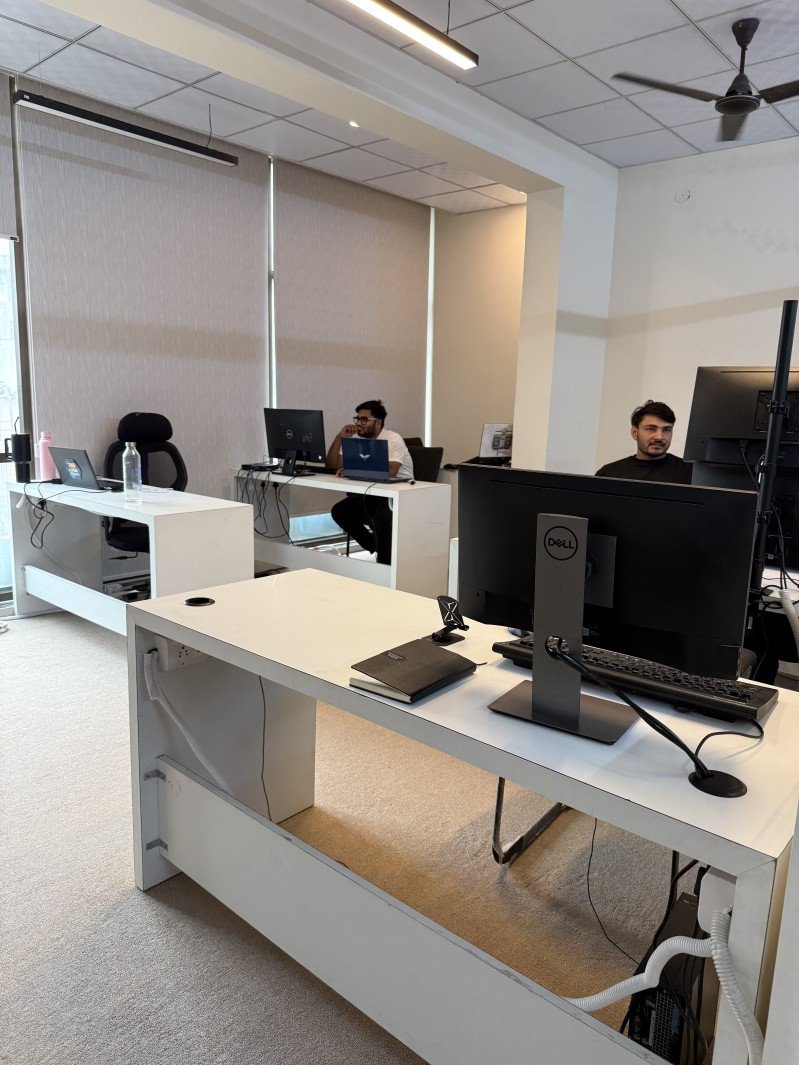
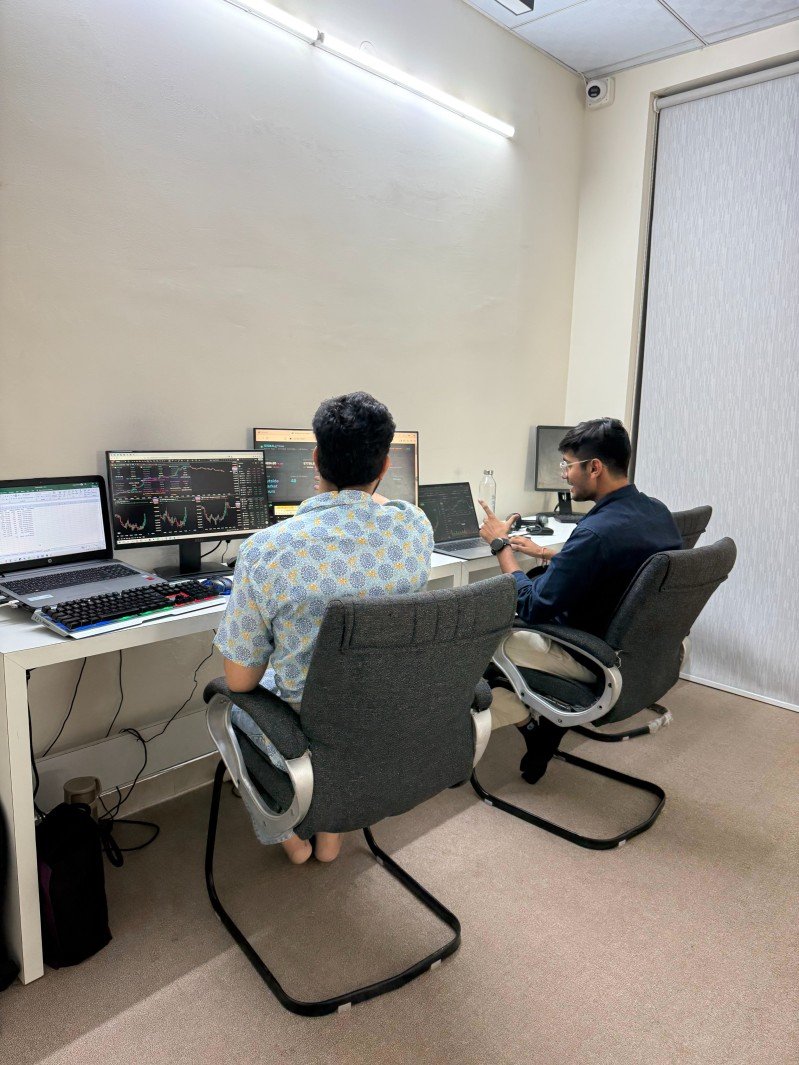
A look at the SRA classroom — students working through live sessions, doubt-clearing and strategy walkthroughs.

Shubham Jain
Hems securities - Head research
I recently overviewed the stock market course at Securities Research Academy, and I must say it's been a game-changer for us. The instructors are highly knowledgeable and experienced, making complex concepts easy to understand. The course material is well structured, comprehensive, and up-to-date. I appreciated the hands-on approach, with plenty of examples, case studies, and practice exercises to reinforce learning.
Rahul Kasliwal
Founder of Adiveer wealth consultant LLP
Being trader for 15 years. One of the leap to the eye aspects of the course was the emphasis on risk management, which has been crucial in ensuring consistent profitability and safeguarding my capital. The structured approach to Algo trading, combined with actionable insights into weekly expiry strategies, has allowed me to achieve significant success and make a handsome profit consistently.
Aditya Chauhan
Algo-trader
I was trading in the market for 1.5 years then I met Aman Bhaiya, He made me familiar on how Algo-trading works. The experience has been transformational for my trading journey. The academy not only provided in-depth knowledge of Algo trading but also equipped me with practical strategies that I could apply to intraday trading. Must recommended and overall good experience I have.
Amit Singh Rawat
Future First mentor
I've known Aman for over seven years and have seen his hard work and dedication towards his research work on trading. From facing setbacks to becoming a consistently profitable trader, his journey is inspiring. And with this academy, he is training traders for algorithmic trading, data-driven technical analysis, and value investing. Excellent institute to pursue trading as a career. Only institute for training Investors mindset.
Vishnu Sharma
Retail Investor
Joining this academy completely changed how I approach the markets. The focus on data-driven technical analysis and disciplined risk management helped me move from guesswork to consistent, well-thought-out trades. The mentors genuinely care about building the right mindset, not just teaching strategies. Highly recommend it to anyone serious about trading as a long-term career.
Amit Singh Rawat
Future First mentor
What sets this academy apart is the emphasis on building a proper investor mindset before jumping into strategies. The training covers algorithmic trading, data-driven technical analysis, and value investing in a structured, practical way. I've seen firsthand how it helps traders move past setbacks and develop real consistency. One of the best institutes out there for anyone serious about trading as a career.
Rajveer Singh
Retail Investor
The dedication this academy brings to teaching algorithmic trading, data-driven technical analysis, and value investing is unmatched. What really stands out is the focus on building the right investor mindset, not just quick strategies. I've seen traders go from struggling with setbacks to becoming genuinely consistent and profitable. Easily one of the best places to pursue trading as a serious career.